OETR: Continent-Ocean Transition Across the NE Nova Scotian Margin
Data collected for the Government of Nova Scotia
Funded by the Offshore Energy Technical Research (OETR) association
Analysis and interpretation of standard MCS (streamer length <~6 km) and OBS (20-40 km instrument spacing) profiles collected offshore Nova Scotia shows a first-order margin parallel change in rifting architecture, from the magma-rich U.S. East Coast margins in the south to the magma-poor Grand Bank/Newfoundland margin in the north. While these data and work were critical for characterizing the largest regional scale structure, more detailed information on the continent-ocean transition anywhere offshore Nova Scotia was lacking. To start filling in this gap, in 2009, a modern dense wide-angle profile OETR (Figure 1) was acquired across the northeastern Nova Scotia margin for the Offshore Energy Research Association by GeoPro GmbH. The much smaller OBS spacing on this profile than on the SMART profiles and the high definition of the crystalline basement available from the coincident long-streamer GXT-2000 MCS line allows for extraction of detailed crustal structural information.
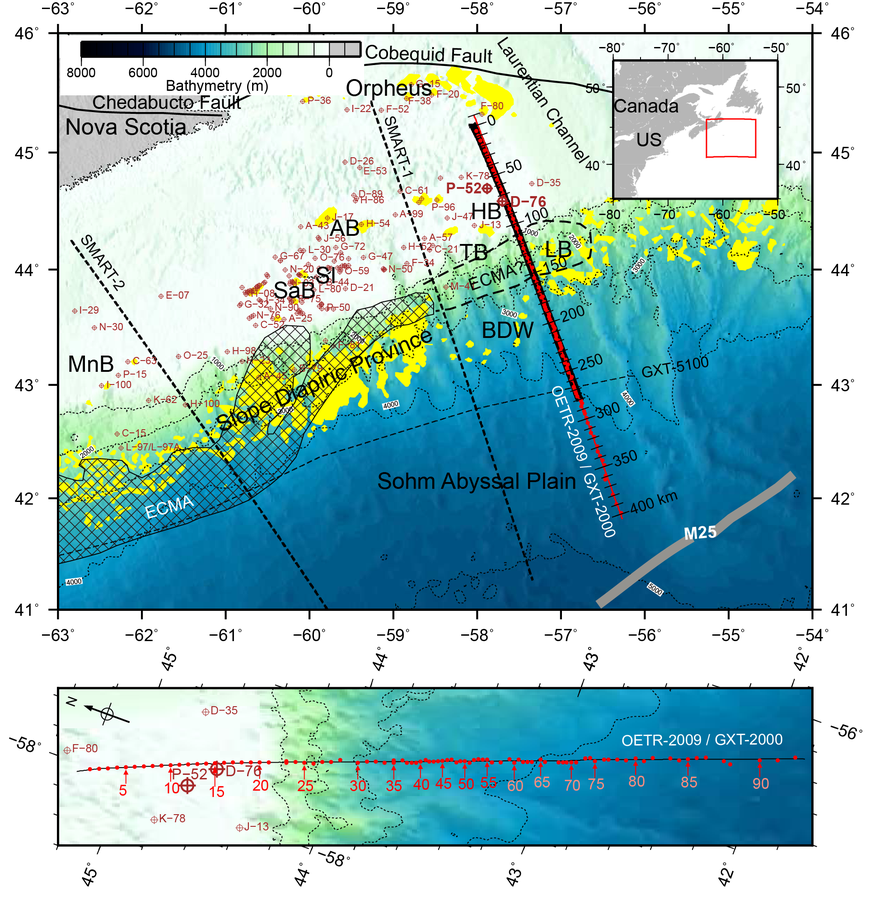
Figure 1. Bathymetry map (color scale) showing locations of the OETR-2009 ocean bottom seismometer (OBS) profile (red thin line is shooting profile and red dots are OBS locations), coincident MCS profile GXT-2000 (thick black line), SMART wide-angle seismic profiles (black thick dashed lines) (Funck et al., 2004; Wu et al., 2006), connecting MCS profile GXT-5100 (black thin dashed line) and selected boreholes (brown). The study area (red rectangle) is shown relative to eastern Canada and United States in the inset. The bathymetry is contoured (thin dotted lines) every 1,000 m. Yellow patches are salt (Shimeld, 2004). Diamond-patterned region is the East Coast Magnetic Anomaly (ECMA) with the black dashed curve outlining its recently proposed continuation (Sibuet et al., 2012). Thick gray line is the M25 magnetic anomaly. The OETR-2009 model distance is tick marked and labeled in black. Area around Profile OETR-2009 is enlarged in the lower panel with OBSs (red filled circles) numbered in red (pink on dark background), shooting line in black, and bathymetry contoured every 500 m. SI = Sable Island; MnB = Mohican Basin; SaB = Sable Basin; AB = Abenaki Basin; HB = Huron Basin; TB = Tantallon; LB = Laurentian Basin; BDW = Banquereau Detachment Wedge. MCS = multichannel seismic.
The OETR wide-angle seismic data were acquired along the 405-km-long profile located ~100 km to the east of the wide-angle seismic profile SMART-1 (Figure 1). Data useful for analysis were recorded on 78 out of the 100 deployed OBSs, all with a sampling interval of 4 ms. Instrument spacing ranges from <3 km across the presumed continent-ocean transition to ~10 km at the seaward end of the profile, and ~5 km for the remaining sections of the profile. Within each OBS, a group of three 4.5-Hz geophones (two horizontal and one vertical component) were mounted at the bottom of a glass sphere, which also housed the seismic recording unit. An external hydrophone was mounted to the top of the sphere. An array of eight airguns (total volume of 64 L), towed at 10-m depth, was fired every 60 s to provide an average shot spacing of ~124 m. Only the vertical geophone and hydrophone data were analyzed (Lau et al., 2018) so far. The results show a >4-km-thick serpentinized mantle layer beneath thin crust within the continent-ocean transition that indicates limited melt supply during rifting. Synrift extension was amagmatic on both conjugate margins but with asymmetry resulting from postrift volcanism on the Moroccan margin.